 |
The IC-756Pro2 block diagram shows that the Monitor audio output from IC371 is mixed with the receiver audio output signal at the input to IC311. IC311 and IC371 are identical devices consisting of an AF amplifier driving a VCA (voltage-controlled amplifier). The Monitor level control voltage is applied to the IC371 VCA, and the AF gain control voltage to the IC311 VCA.
The IC311 VCA output drives the AF PA IC332 via IC331 (mute switch). The AF PA, in turn, drives the speaker and PHONES jack. A fixed (line-level) audio signal is tapped off the IC311 VCA input, and fed to ACC1 Pin 5 (AAFO line), thus bypassing the headphone/speaker audio output chain.
It is evident from the results obtained that the frequency response of the IC311 VCA, and that of the AF PA IC332, are playing a role is determining the observed differences between the noise spectra (taken at ACC1 Pin 5) and the measured voltage values (taken at the PHONES jack).
Conditions:
| COMP OFF, WIDE. Ref. 0 dBr (1V) at fo = 1000 Hz. | |||||
| f1 (Hz) | f2 (Hz) | BW Hz | @ | dB Points | equiv. mV |
| 95 | 2290 | 2195 | -3 | 707 | |
| 85 | 2893 | 2808 | -6 | 500 | |
| 73 | 2915 | 2842 | -10 | 316 | |
Conditions:
Remarks:
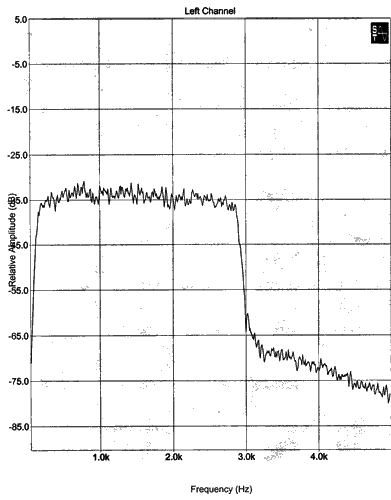
I have taken linear and logarithmic white-noise response spectra of the IC-756Pro II Monitor output. These were obtained by injecting white noise into ACC1 Pin 4 from the NCH Tones program via the 802A mixer with flat EQ, using the laptop computer. Transmitter power was set at 60 watts PEP; no COMP; WIDE mode. Oscilloscope monitoring of audio input signal and RF output envelope showed no clipping or compression. An input noise signal test spectrum was obtained for QC purposes, but is not shown here. It was uniform in level at -35 dB on the log scale using the same frequency range as the plots.
Two sets of spectra were taken; the first from ACC1 Pin 5, and the second from the PHONES jack. For all runs, the Monitor output was fed through the 802 side-chain to the soundcard and the SpectraPRO program on the shack desktop computer where the spectra were captured.
It is interesting to compare the numerical data points with the spectral graph for the PHONES jack. It would appear from the numerical data that the PHONES jack gives a passband of 85 ~ 2893 Hz @ -6 dB, or 2808 Hz bandwidth . The spectral graph would indicate that the PHONES jack rolls off faster on the low end, being about 15 dB down at 85 Hz compared with 6 dB for the measured data.
A comparison between the spectral plots for the ACC1 Pin 5 and PHONES jack also reveals significant differences in frequency response. As discussed under "Note on Monitor Audio Signal Paths" above, the differences are readily apparent when comparing the spectral plots of monitor audio taken from ACC1 Pin 5 and those taken from the PHONES jack. For the PHONES case, the upper end rolls off much more slowly than for the ACC1 Pin 5 case. The high-end -3 dB points diverge noticeably: 2290 Hz @ -3 dB for the PHONES jack, vs. approximately 2900 Hz @ -3 dB for ACC1 Pin 5.
By contrast, the -6 dB points for the two cases are very close. The headphone/speaker output yields a Monitor bandwidth of 2893 - 85 = 2808 Hz @ -6 dB, while the spectral plot taken from the ACC1 output shows a bandwidth of approximately 2950 - 120 = 2830 Hz @ -6 dB. Considering the error involved in reading numbers from the graph, the results are essentially identical, showing a monitor bandwidth of around 2800 Hz compared with an RF power output bandwidth of 2916 Hz (or around 2900 Hz.)
For monitoring purposes, this appears to me to be more than adequate congruence between the frequency ranges of the transmitter and monitor. The monitor will not reproduce quite the lows that are being transmitted nor the highs, but the departures are small at best. Nonetheless, the data have value in confirming such conclusions.
By listening to the Monitor signal, and adjusting the bass and treble level settings in the IC-756Pro transmit EQ menu, and the occupied-bandwidth (BW) setting, I can quickly and easily arrive at a setting that I want for a particular purpose, be it "hi-fi" for rag-chewing, or "down and dirty" for pile-ups. This capability is rather like the mirror image of the ease with which a receiving passband can be constructed and placed as required. Read Adam VA7OJ/AB4OJ's notes on the Monitor.
Third-Order Intermodulation Test:
This test was performed on an IC-756Pro, using a PSK31 two-tone idle signal of sufficient amplitude to drive the IC-756PRO to 40W PEP output. At the signal-source output, measured IMD3 was -64 dB relative to PEP. At the Monitor jack output, measured IMD3 was approx. -58 dB relative to PEP.
Copyright © 2003, George T. Baker, W5YR (including all images).
Page created by A. Farson. Last updated: 09/25/2019